
How to use
The Entropy Triangle package for Weka includes a visualization plugin and new evaluation metrics. The package can be used from the Weka GUIs and programmatically.
The Entropy Triangle visualization plugin
The Entropy Triangle is accessible from the Weka Explorer and the Weka GUI Chooser window.
When called from the Weka GUI Chooser window, will be displayed an empty plot. This is the form to open the visualization to load a file with data of another session.

Add data from the Explorer
The evaluation data of a classifier tested on the Weka Explorer can be added to the Entropy Triangle.
For that, select on the Result list the test you want to add and right-click on it to open the context menu. Then, move the cursor to Plugins to open the visualization plugins sub-menu and click Entropy Triangle.
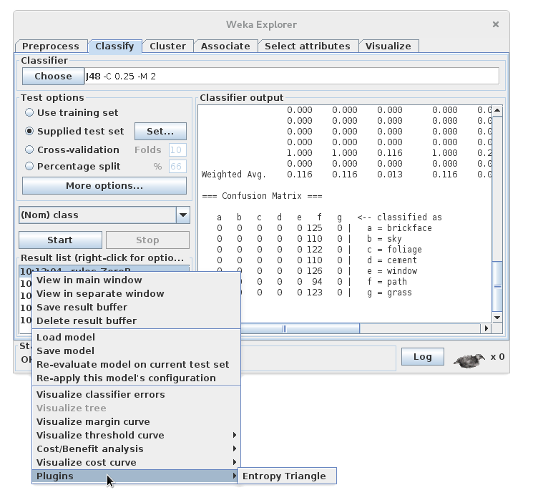
The data will be added to the existing window of the Entropy Triangle. If you do not have the Entropy Triangle window already opened, a clean new plot will be generated.
Changing the colorbar metric
The bottom panel of the Entropy Triangle titled Metric colour is a modified version of the Weka's "Class colour" panel.

The metric can be changed clicking in the upper-left combo box. This will open a drop-down list with all the available metrics and related information of the data. Choosing an evaluation metric draws a colorbar with the values adjusted to the range of the metric. When the label represents a non numeric value, i.e. the relation name or the classifier, colored text labels are drawn. As in the Weka class panel, the color of the text labels can be changed clicking on them.
Split mode
The Split button toggles between showing in the plot the points that represent the marginals entropy balance equations. For more information about this, see the theoretical background of the plugin.
ΔH'(x) line
The ΔH'(x) line marks the normalized distance in entropy of the dataset likelihood from the maximum. This distance determines the upper bound of the mutual information \( MI' \leq 1-\Delta H'_X \). Recall that maximum entropy means a balanced dataset, and it is supposedly desirable.
This line defines the limit of performance of the classifier due the test set.
Remove data
To remove a point from the plot, right-click on it to open the point context menu, then select delete.
To erase all the data close the window. A clean empty plot will be loaded when opening again the Entropy Triangle window or adding data.
Save to a file
The Entropy Triangle lets you save the plotted data. The information is saved in the Weka instances format, similar way that the Weka Experimenter files. Each classifier tested is an instance, and their information are the attributes. This is the dataset name, classifier name and options, evaluation metrics, and timestamp information.
When the Entropy Triangle has data plotted, the upper-right button is titled Save data. Click on it to open a dialog to choose the file name and format. You can choose between several file formats, the native Weka file formats: arff, xrff and the binary bsi, and CSV or JSON, to export the data more easily.
Load file
Open the Entropy Triangle from the Weka GUI Chooser window. The upper-right button of the empty plot will title Load data, click on it to open the file selection dialog.
Screenshot the plot
To take a screenshot of the graph window do Ctrl+Shft+Alt+Left Mouse Click. You can save the image in bmp, jpg or png.
Package Metrics
The EMA and the NIT factor will appear on the evaluation report without any additional user action, as they are implemented as standard evaluation metrics.
How to output information-theoretic metrics
The rest of the package metrics are implemented as information-theoretic evaluation metrics. This means that are setting off by default, and only added to the evaluation report by user request.
To ouput them in the Weka Explorer go to the Classify tab, open the More options... window, and set the Output entropy evaluation measures option. If you want to print metrics selectively, open the Evaluation metrics... dialog and unselect those that you want to remove from the report.
In the Weka Experimenter all the metrics are available by default.